Sales Data Analysis & Interactive Dashboard

💡 The Problem Statement
A retail business struggled with:
Scattered and unstructured data from multiple store locations.
Time-consuming manual reporting that slows down decision-making.
Limited analytics expertise among business teams, making advanced insights inaccessible.
🎯 My Solution
This project eliminates these challenges by providing an Excel-based self-service analytics system with:
✅ Automated Data Entry – A user-friendly form ensures structured data collection without errors.
✅ Data Cleaning & Processing – Built-in logic standardizes, validates, and prepares data for analysis.
✅ Statistical Insights – Includes descriptive statistics, trend analysis, and hypothesis testing (T-Test) for data-driven recommendations.
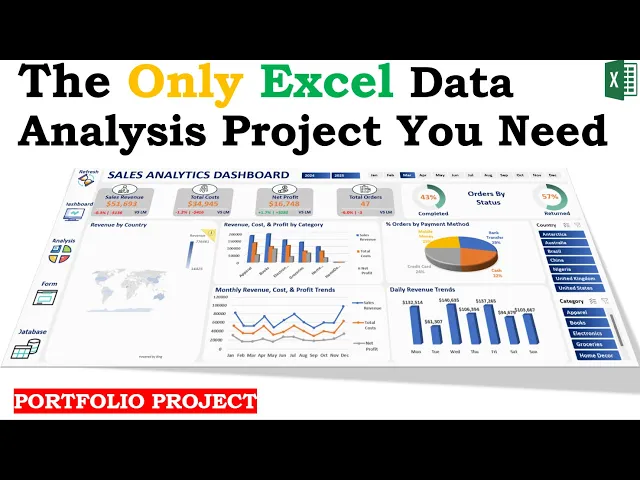
✅ Dynamic Sales Dashboard – A beautifully designed interactive dashboard that updates automatically, allowing users to:
Track revenue trends, sales growth, and regional performance.
Monitor store-wise and category-wise sales for better inventory and pricing strategies.
Compare KPIs across multiple locations to identify top-performing stores.
📊 Potential Business Impact:
🔹 Time-Saving Automation: Eliminates manual work, reducing reporting time by over 80%.
🔹 Better Decision-Making: Empowers executives to act on real-time sales trends rather than outdated reports.
🔹 Cost-Effective: No need for expensive BI tools Excel ensures accessibility across teams.
🔹 Scalability: The system can be easily extended to accommodate new stores, products, or business needs.
🔧 Key Technical Highlights:
Micro VBA Automation: Custom-built VBA scripts automate data entry, validation, and backend logic without exposing complexity to end users.
User Form Interface: Interactive Excel-based user form simplifies structured data input while enforcing data integrity rules.
Power Query ETL: Used Power Query for automated data extraction, transformation, and loading—handling cleaning, standardization, and reshaping with minimal user intervention.
Pivot Tables & Slicers: Dynamic pivot tables with slicers allow interactive drilldowns by region, category, and time period.
Descriptive & Inferential Analytics: Built-in statistical engine using Excel functions and T-Tests for on-the-fly insights and hypothesis validation.
Dynamic Dashboards: Fully automated, interactive Excel dashboards with conditional formatting, charts, and KPI indicators that refresh with new data.
Named Ranges & Dynamic Arrays: Utilized named ranges, Excel Tables, and dynamic array formulas (e.g.,
FILTER,UNIQUE,SORT) to keep models scalable and modular.Modular & Scalable Architecture: Designed workbook structure with reusability in mind, allowing quick adaptation to new stores, regions, or sales dimensions.
Zero External Dependencies: Entire solution runs locally in Excel, eliminating the need for third-party BI tools or internet access.


